
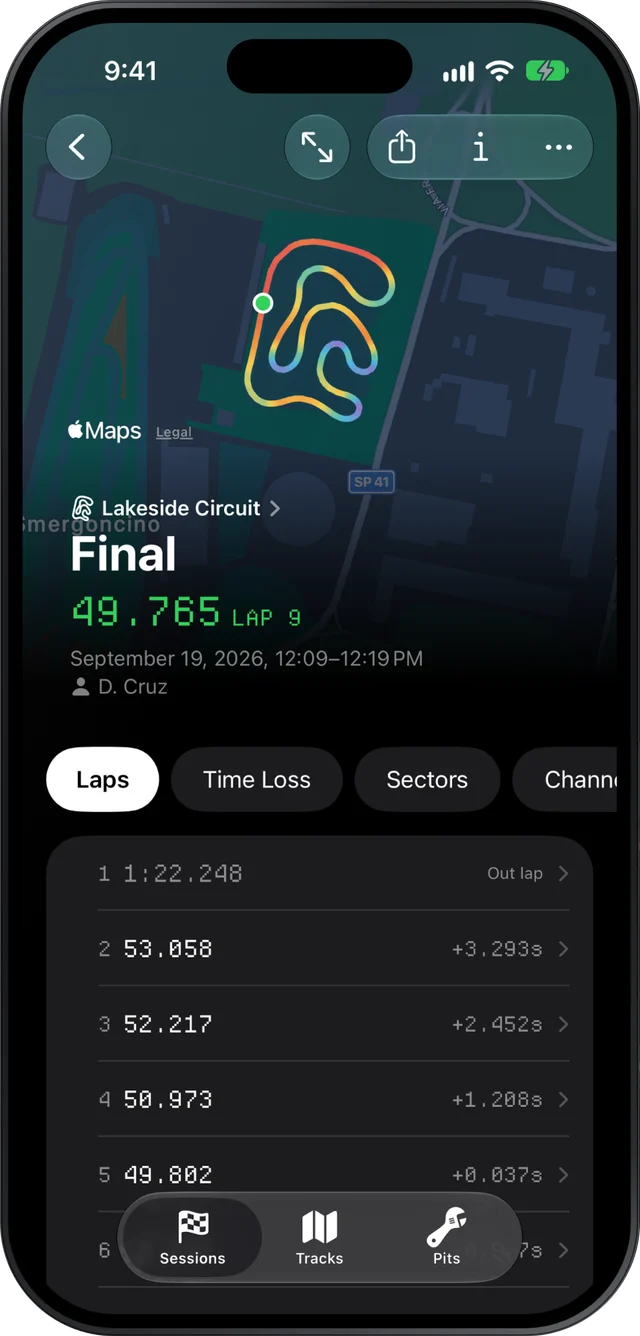
Slicks draws your kart's lap on the real circuit and colours it by any reading in the session: speed, lateral g, longitudinal g, altitude, RPM, or water or exhaust temperature, and on the Mac any other channel your AiM or MyChron logged. Hold the map anywhere and it shows the exact value at that point, how far into the lap it is and the time.
Where the map is
The top of every session is your fastest lap on the track, coloured by speed. Tap it and the full map opens with the start line and the sector markers pinned on it. Tap any lap in the list and it opens on its own, with its map at the top. The colour key at the foot of the map is also the menu that changes what the colours show: speed, the two g readings, altitude, RPM and the temperature sensors your kart carries. On a lap's screen, tapping a chart's title puts that reading on the map as well.
On the Mac, the Track tab puts the map in the middle of the window with pickers for the reading and the lap, and the six GPS channels for that lap underneath. There, any channel the logger recorded can colour the map.
Reading the colours
The colours run from lavender for the lowest reading, through sky blue, sage green and warm yellow, to orange and coral red for the highest. A key at the foot of the map gives the range the colours cover, so you know what "red" means on this lap.
Each reading answers its own question:
| Colour the map by | What it shows you |
|---|---|
| Speed | Where you're fast and slow; the shape of every braking zone and exit |
| Lateral g | How hard the kart is cornering: corners one way take one end of the ramp, the other way the other end |
| Longitudinal g | Where you brake and how hard, and where the kart pulls out of a corner |
| Altitude | The rises and dips, worked out from GPS; read it as up and down, not exact height |
| RPM | Where the engine peaks on each straight, and how far it falls in each corner |
| Water or exhaust temperature | Mostly the trend over the lap; these change slowly |
Reading one corner
Take a corner with speed on the map. Coming down the straight the line is orange or red. Where you brake, it steps down through yellow and green. The coolest point is your minimum speed, the apex you actually drove, which is not always the apex you aimed for. Where the warm colours come back is where the kart started gaining speed.
Things worth spotting:
- The coolest point is early. You slowed most before the turn-in, then coasted. The kart is often quicker carrying more speed in and taking the slowest point later.
- The cool stretch is long. A long band of blue means a long time at low speed. Shortening it is usually worth more than raising the minimum by a km/h.
- Warm colours come back late. The exit is slow, and every metre of straight after it pays for that.
Then switch to lateral g. Lateral g has a direction, so left-handers and right-handers sit at opposite ends of the ramp, and the straights, near zero, take the middle colours. What matters is how strong the colour gets: a corner that stays close to the straights' colour is one where the kart is not being asked for much grip. Our kart g-force analysis page covers what the two g readings tell you in more depth.
Hold to read the exact value
Colours are for the shape. When you want the number, press and hold on the map. A dot snaps onto the lap nearest your finger, and a small callout shows the reading at that point, the distance into the lap and the lap time there. Slide your finger and it follows the line. Let go and the dot stays put, so you can look at it; tap the map to clear it.
On an iPhone, you feel a light tap as the dot crosses into a new sector, so you can find a sector line without looking for its pin. With VoiceOver, the reading can be stepped along the lap instead of held.
On a lap's own screen, the map and the charts below it share one cursor. Hold the map at the slowest point of a corner and every chart marks the same spot, which is how you get from "this corner looks slow" to "braking started 10 m earlier here".
Sector markers on the map
The start line and each sector boundary are pinned on the map. Sectors in Slicks are equal lengths along the lap, so a marker can sit in the middle of a corner; that is expected. Pair the map with the sector times to see what each slice cost.
What the map can't show
The map draws GPS, and GPS is not perfect: lines near trees or tall buildings wander, and a metre of difference between laps is often the satellites. Slicks also can't colour the map by the time gained or lost against another lap on one line; for that, compare the two laps and read the gap chart.
