
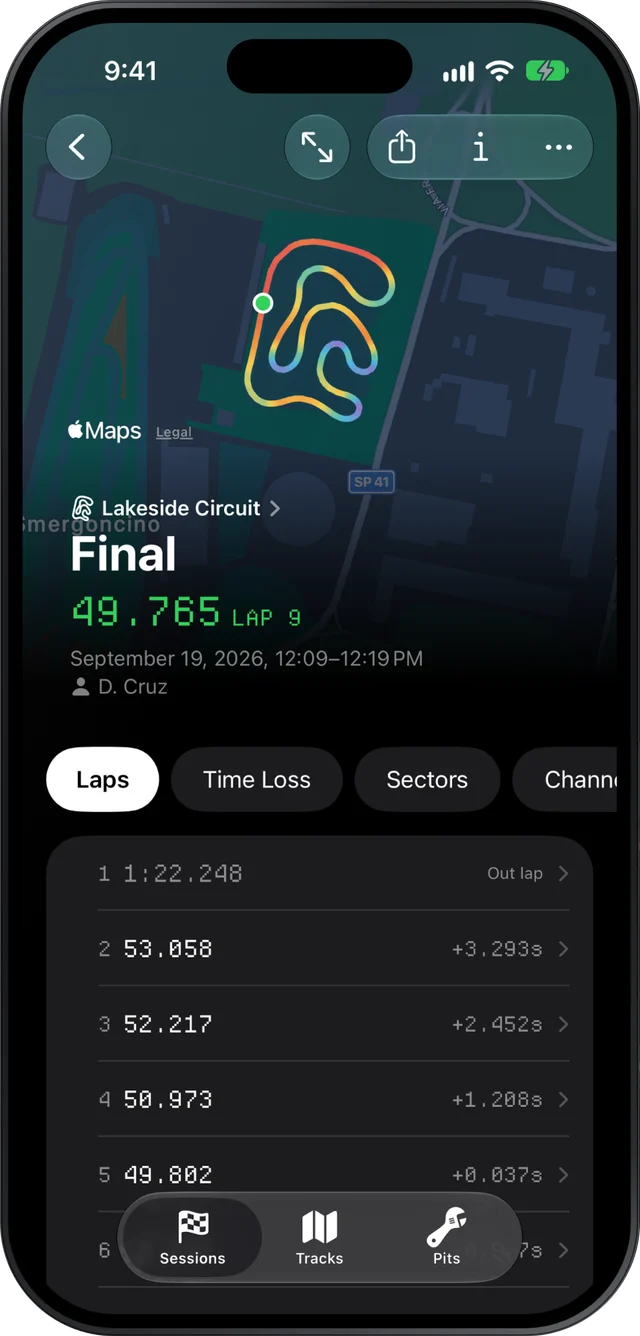
Slicks puts kart data on the iPhone you already carry. Open a MyChron or AiM session from Files or AirDrop and, with one hand and no signal, you see every lap time, the corners that cost the most, the sectors and theoretical best, and the engine's peaks against its window. Hold the map to read any value on the lap.
Getting the file onto the phone
The session comes off the logger with AiM's own tools, the way you download it today. From there, AirDrop it from the laptop, save it to a shared folder, or send it by Messages or email, and open it from the Files app. An XRZ file is the same session compressed; it opens just the same, with no unzipping.
Slicks reads the file on the phone itself. It needs no AiM software and no internet, which matters at the tracks where the signal drops out behind the pit building. If you are signed in, the session syncs to your iPad and Mac when the phone is back online.
One-handed answers
The session screen leads with the fastest lap drawn on the track in the colours of its speed, with the lap time, lap number, track, date and driver. Under it, a row of pages you switch with your thumb:
- Laps: every lap's time and gap to the fastest, the out lap marked, and the consistency figures.
- Time Loss: the three corners that cost the most on average, each with how many tenths, the slowest-point speed difference and how far the braking point moved.
- Sectors: the best time through each sector and the theoretical best they add up to.
- Setup: the engine's peaks against the window, every channel's range, and the kart's setup.
- Notes: whatever you want to remember.
One page at a time is deliberate. Between heats you want one answer, not a dashboard. Tap the first corner on Time Loss and Slicks opens Compare with the lap that lost most there, raced against the fastest.
Hold the map to read a value
Tap the map for the full screen version. Change its colours from speed to lateral g, longitudinal g, altitude, RPM or any temperature the logger recorded, then hold a finger on the track: a cursor snaps to the lap and reads out the exact value at that point. It is the quickest way to answer "how fast was I through there?" without reading a chart.
A lap, and two laps
Tap any lap to open it on its own: its trace on the map, its sectors against the session's bests, and every reading charted against distance under it, with one cursor across all of them. Press play and the lap runs round the map at 1×, 2× or 4× real speed.
To compare two laps, hold a lap row to start picking and choose a second, or tap Compare Laps at the end of the list. Both laps run on the map, faster in green and slower in red, with the gap between them charted along the lap and every reading as two lines. Press play and the two laps race from the same point, each at its own pace. The time loss by corner page explains how to read the gap.
Turn the phone for a chart
A chart on a phone held upright is narrow. Every chart on the lap screen opens full screen, and on iPhone it turns to landscape so the lap runs across the long side. The cursor and the playback come with it, so you can scrub through one braking zone at full width and turn back to the lap without losing your place.
When the phone isn't enough
Some jobs want a bigger screen: a long session's laps in a table, the engine and setup kept open beside the laps, two sessions in two windows. Those are on the iPad page. Your library is the same on every device you sign in on, so the phone at the track and the iPad or Mac at home show the same sessions.
What Slicks on iPhone does not do: it does not download from the logger or set it up, it shows nothing live while you are on track, and it does not read Alfano or other non-AiM files.
